Department of Bioengineering data
In the interest of transparency to our community, we are publishing here the most complete and detailed demographic information we have on students in the Department of Bioengineering. This page will be updated as more data becomes available.
|
Important Terms |
Census – our enrolled students
|
Important Terms Apps Admits Attend / SIR % admit % yield |
Admissions
Note that when raw numbers of admitted and attending students are low, small numerical changes have a large effect on admit and yield percentages.
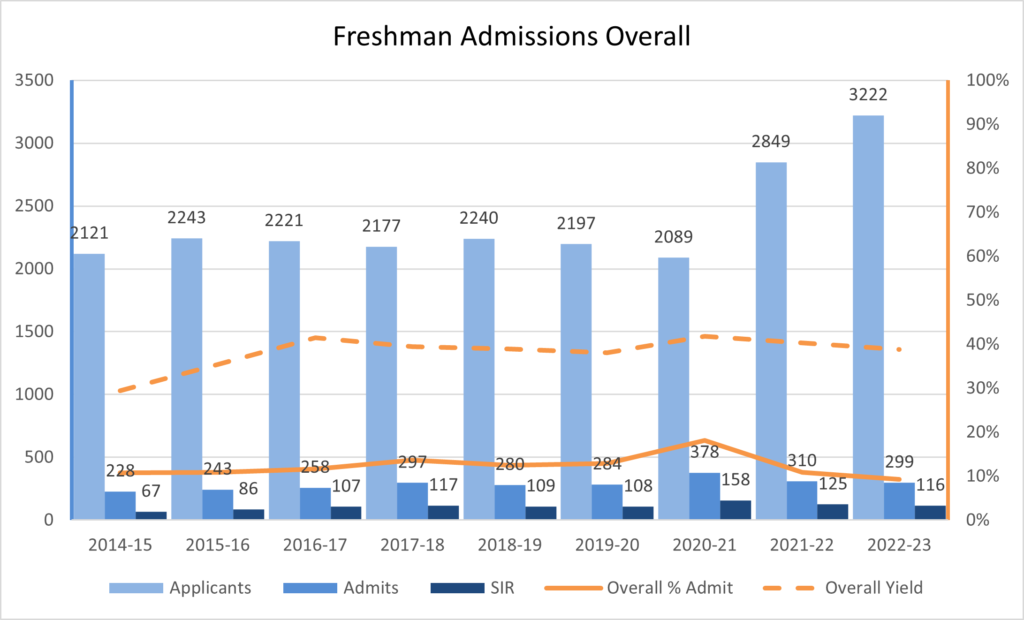
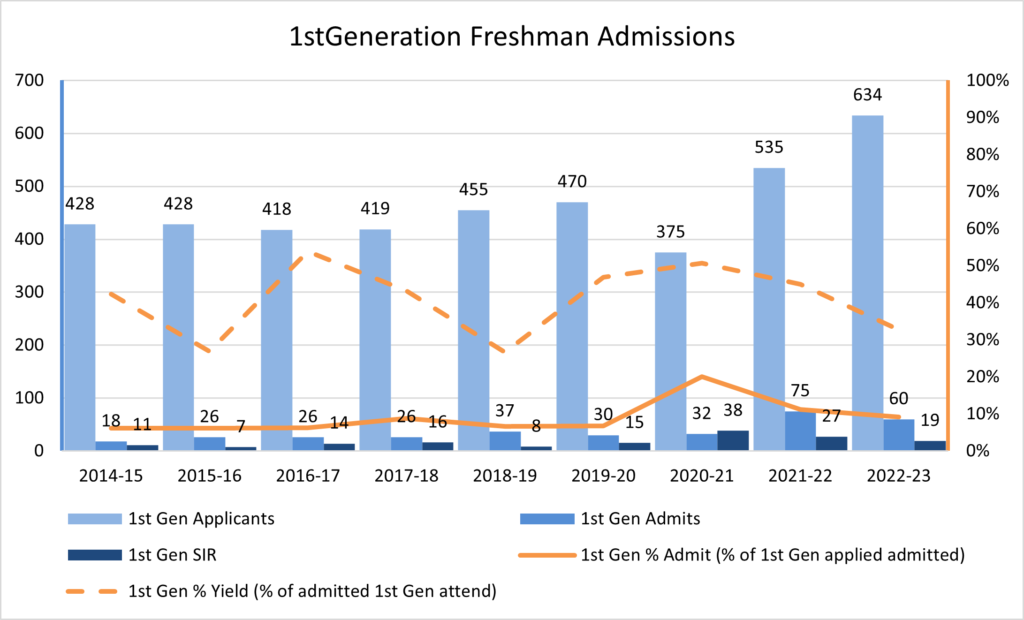
Undergraduate 1st Year Admissions (Freshman)
All first year applications to UC Berkeley are handled centrally by the Office of Undergraduate Admissions using a Holistic Review process, where no one piece of information is weighted more heavily over another.
The department faculty and staff are not involved in selecting who is admitted as a first year bioengineering student. The College of Engineering provides general guidance to the Office of Undergraduate Admissions on the size of the desired incoming class and some minimum standards. The department, college and campus work together using past data to project the yield rate for the upcoming year in order to achieve the desired entering class size. This yield can be affected by not only the popularity of Berkeley and Bioengineering, but also state, federal and international politics and economics.
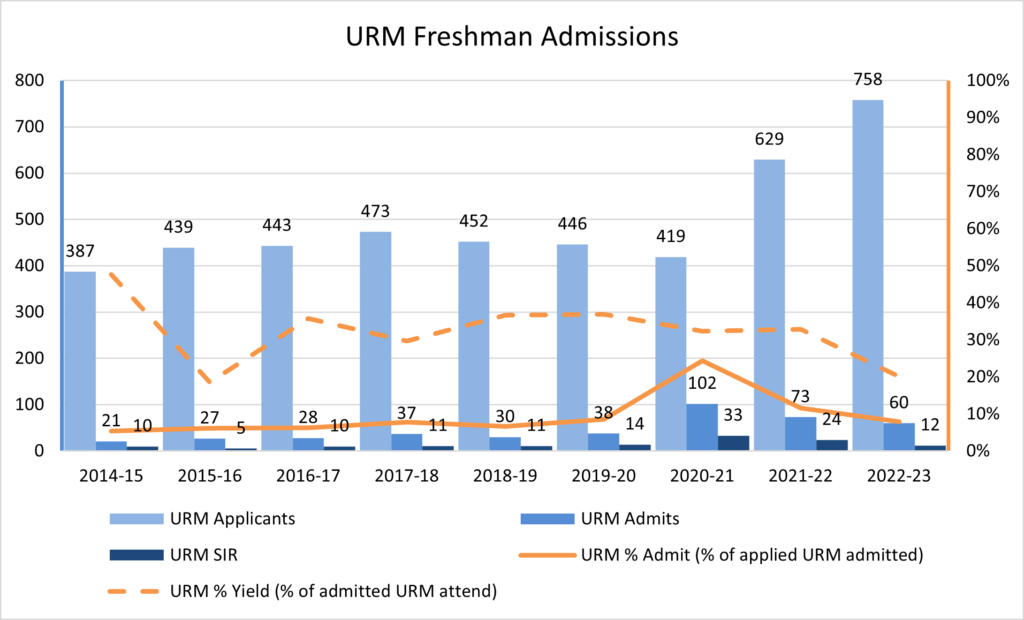
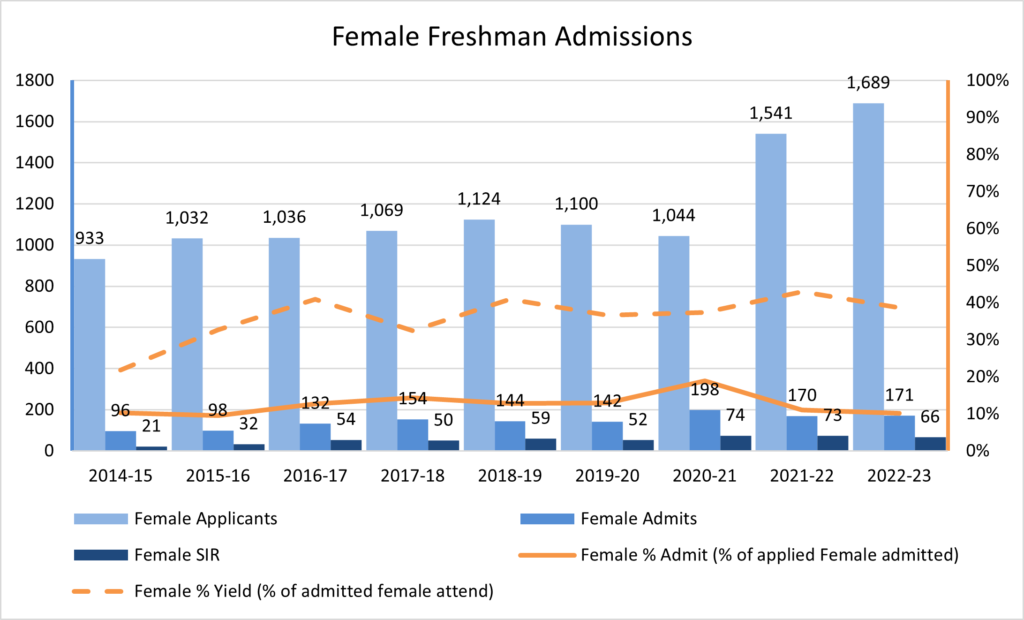
For the most recent admissions cycle for Fall 2020, we had a record high incoming class of 166 students, with a record 45% yield. Our new class also had record high numbers of URM, female and 1stGen admits and attending students. We happily welcome a 1st year class that is 23% URM, 46% female and 25% 1stGen. In the 1st-year admissions process for the Fall 2020 cohort, the Office of Undergraduate Admissions reviewed applicants in an even more holistic way, relying less on numbers and considering students’ whole life story. We applaud this long-awaited change and how it has resulted in improved access for URM, female and 1stGen students.
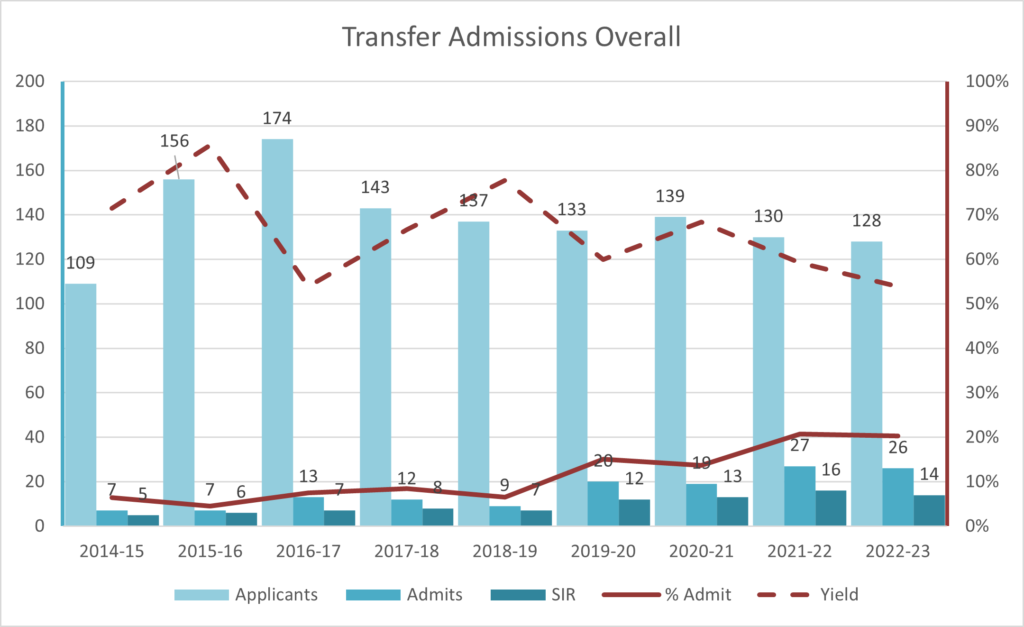
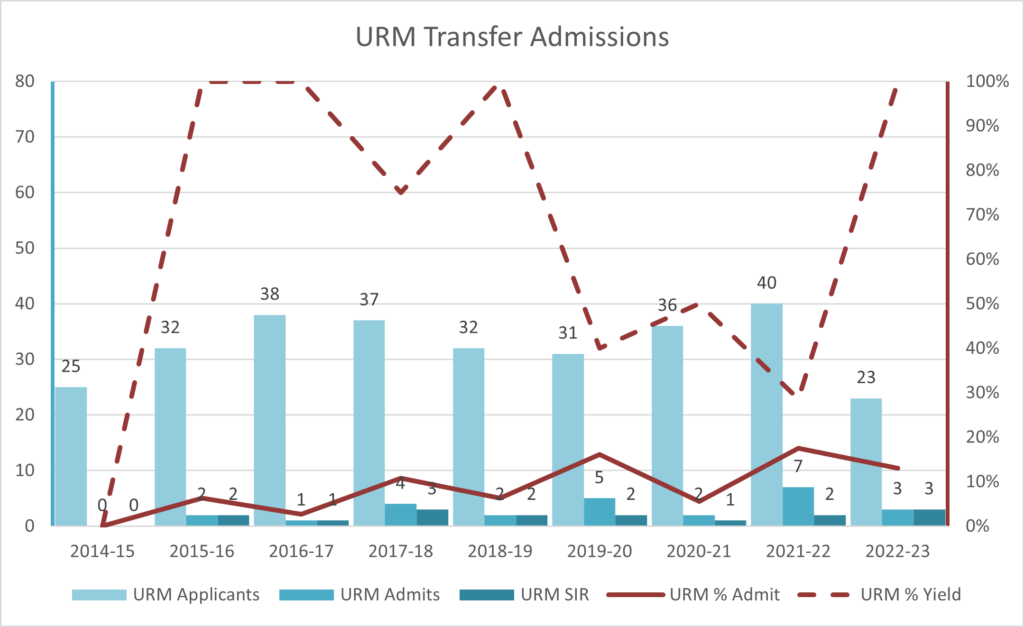
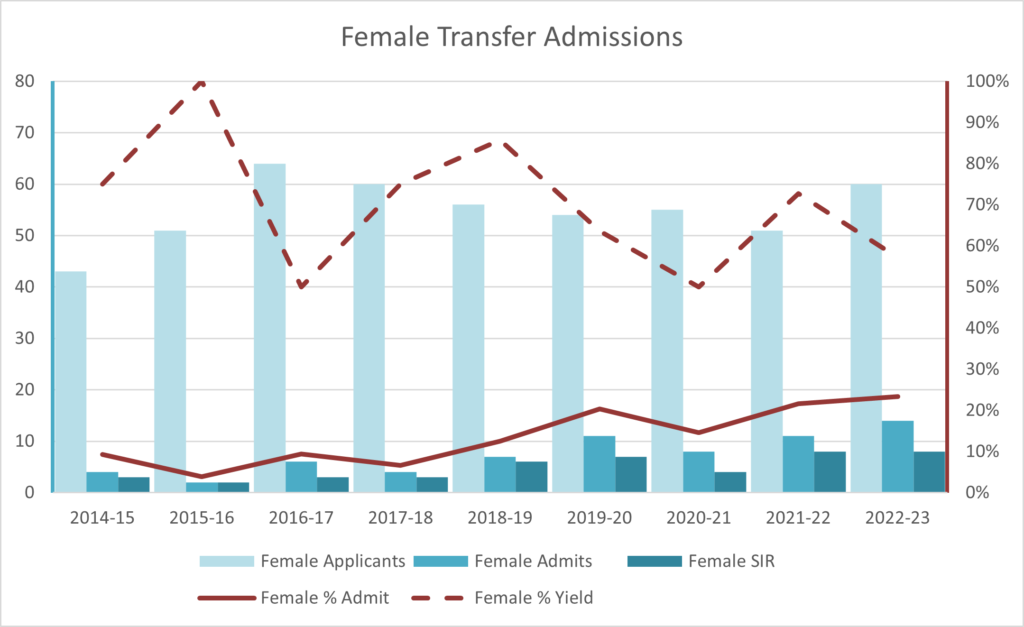
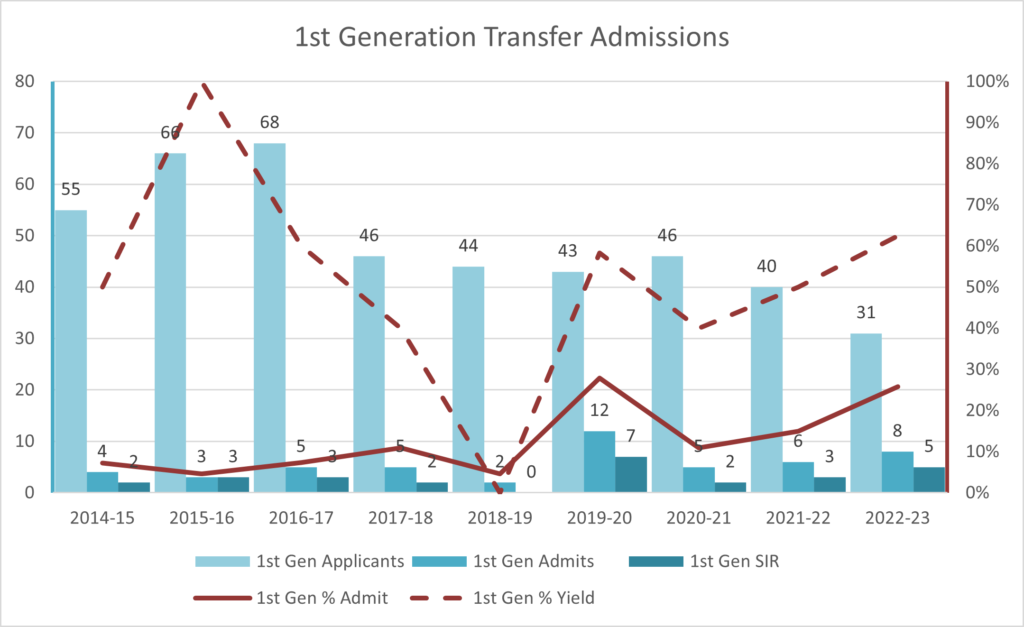
Transfer Admissions
Junior Transfers are students who have attended a community college or other university and applied to transfer to Berkeley for their final two years. Transfer admissions decisions are made using a Comprehensive Review process.
Transfer admissions decisions are made by a committee of College of Engineering and Bioengineering faculty and staff. Strong guidelines and criteria are established and defined rubrics used for scoring applicants.
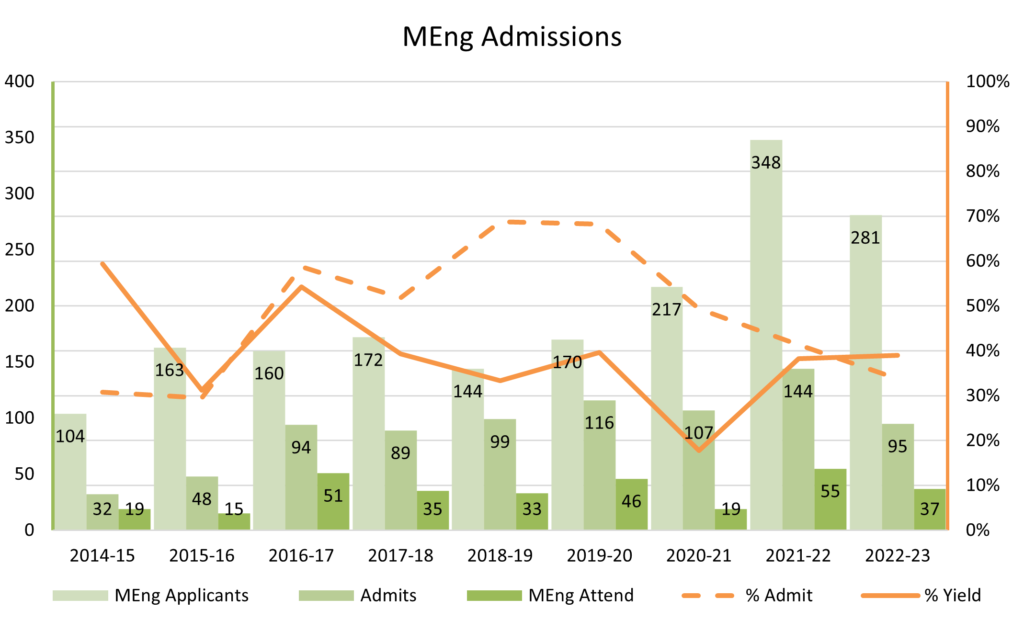
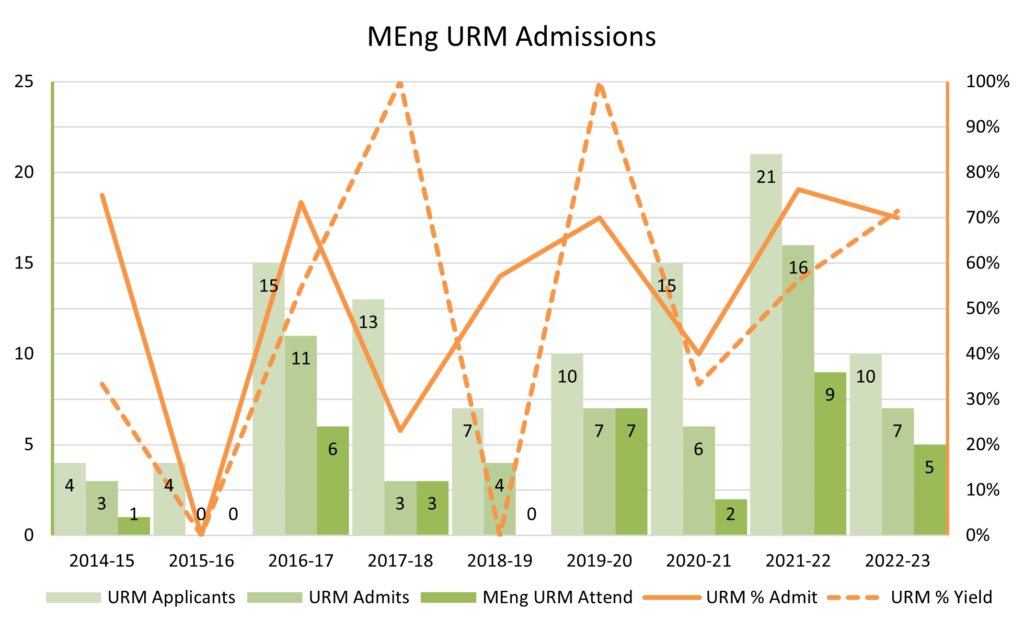
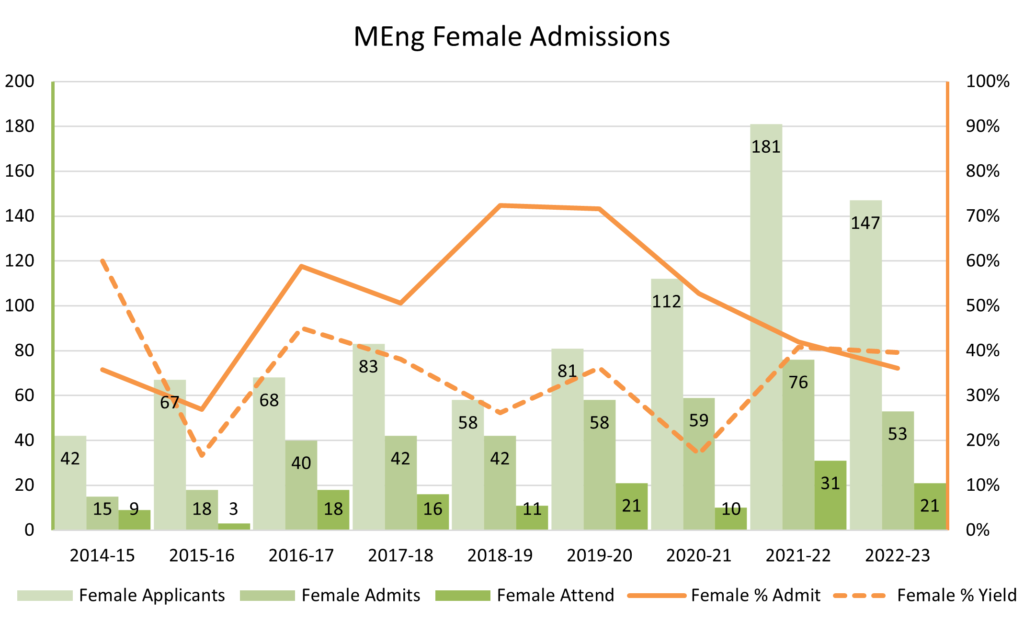
Graduate Admissions
Admissions at the graduate level are handled by the department or program leadership with guidance and oversight from the College of Engineering and Graduate Division. A committee of faculty, staff, and in some cases senior students, score and evaluate applicants using an approved rubric.
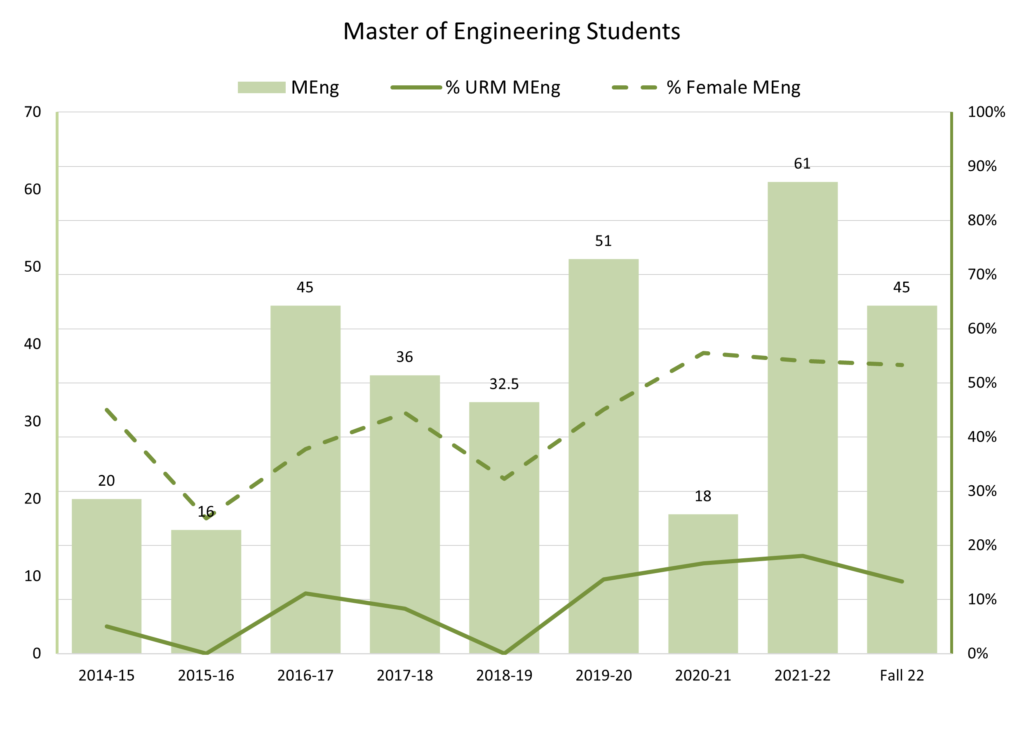
Master of Engineering
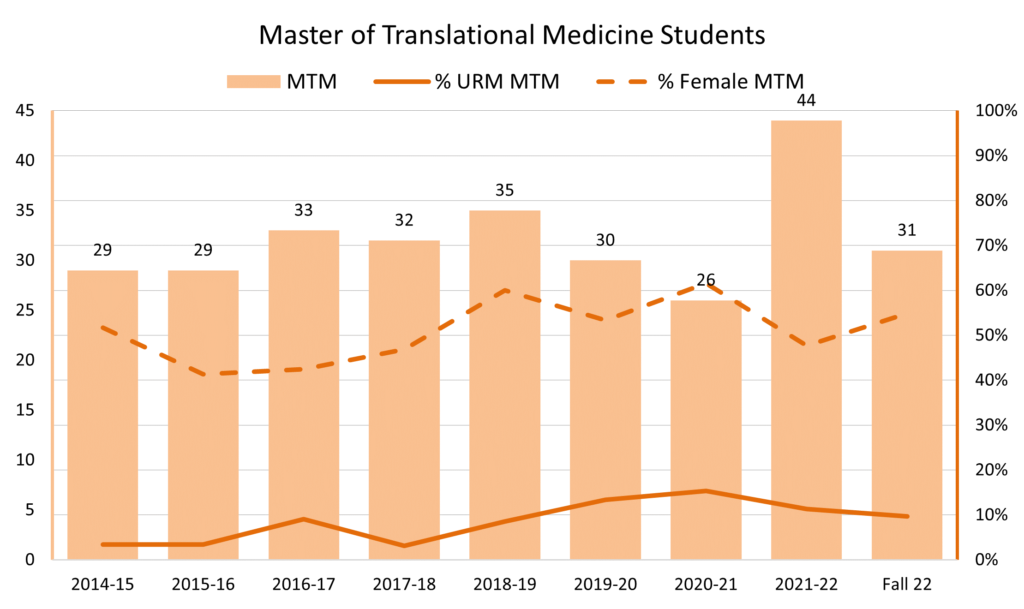
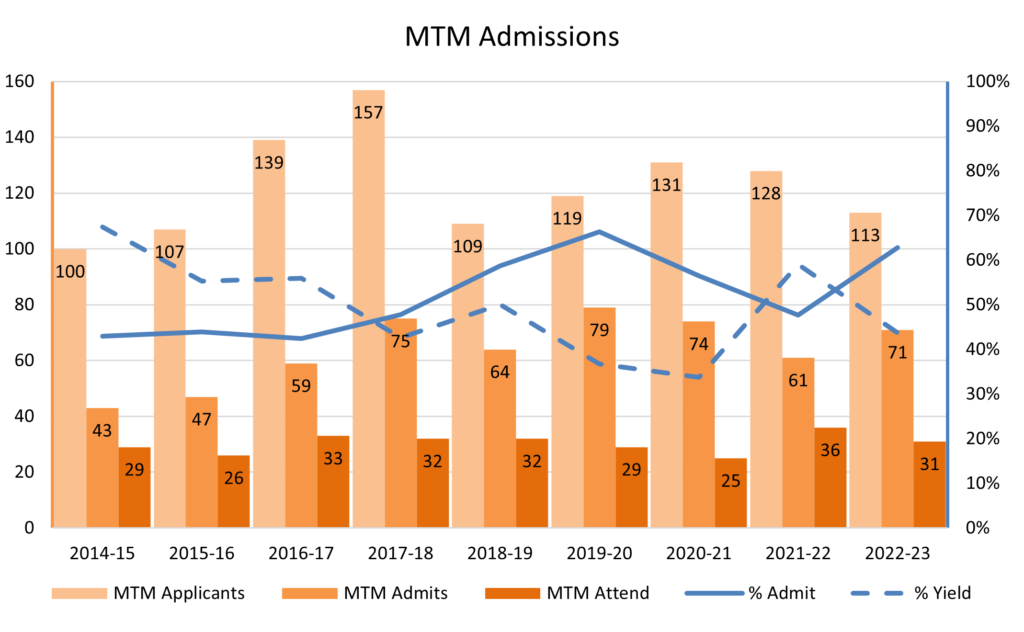
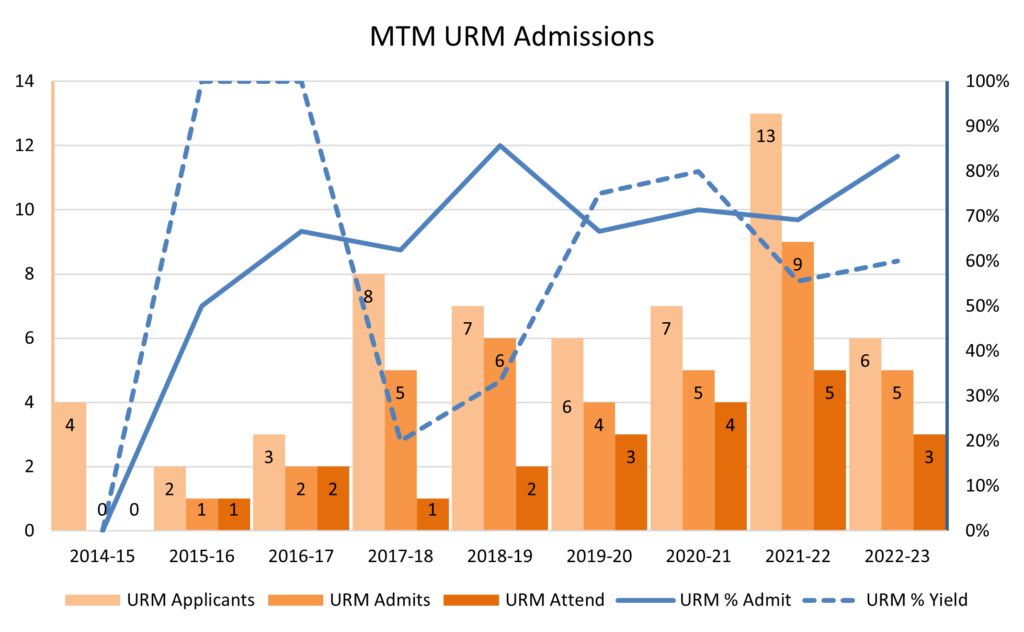
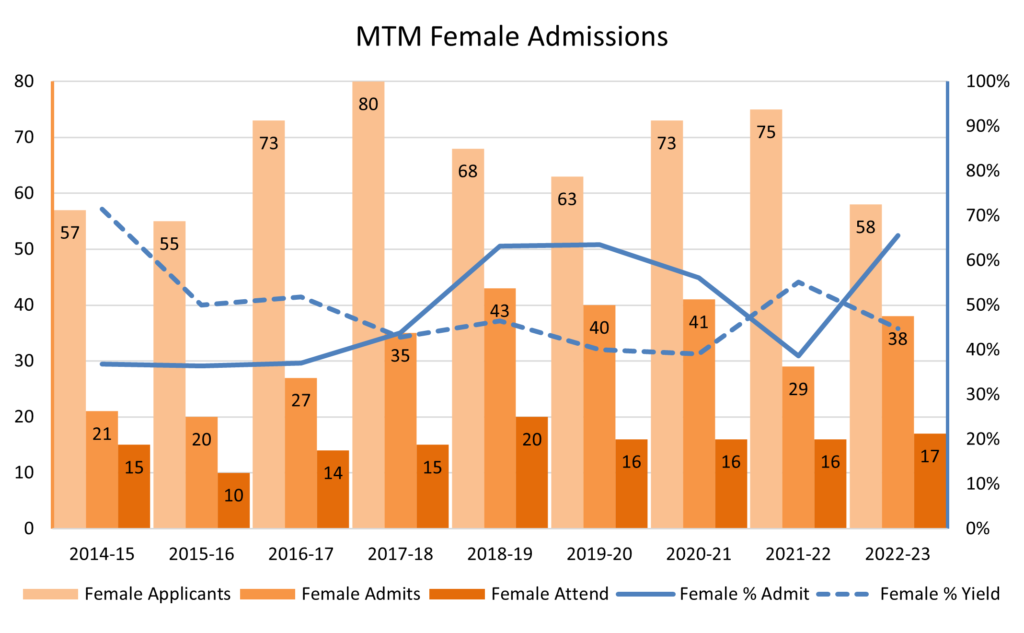
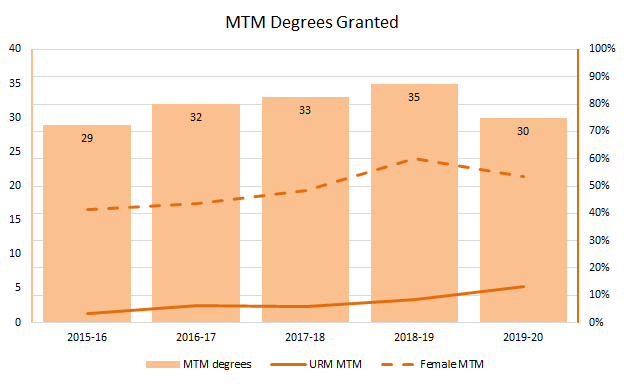
Master of Translational Medicine
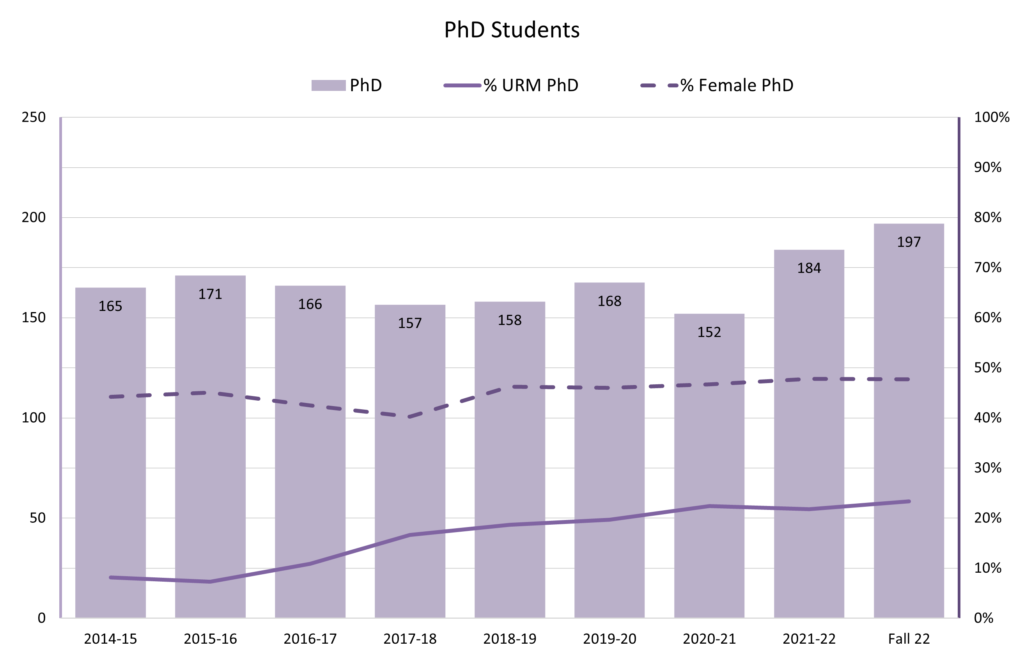
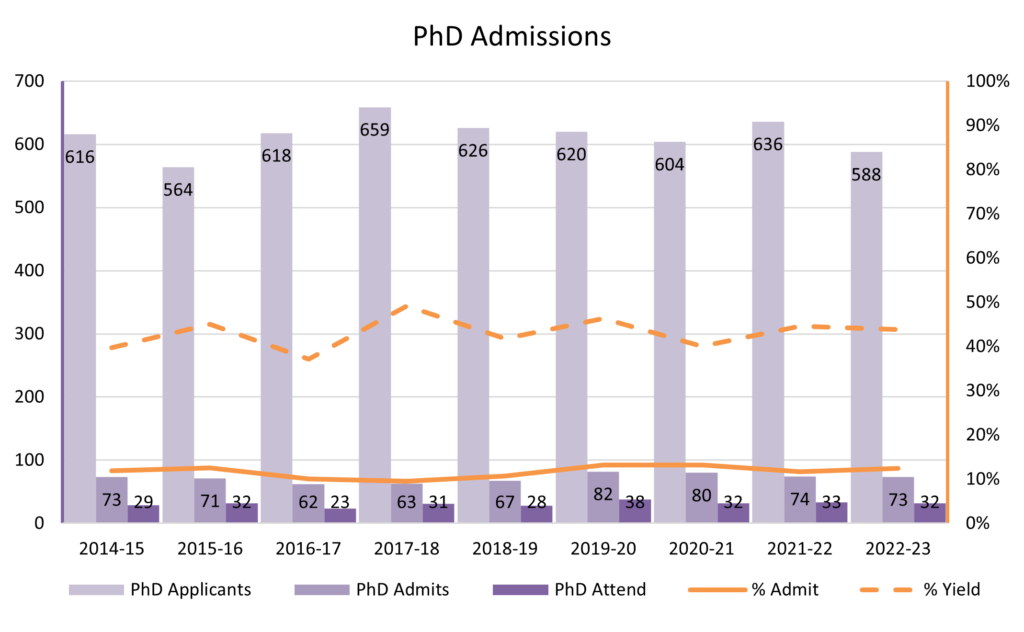
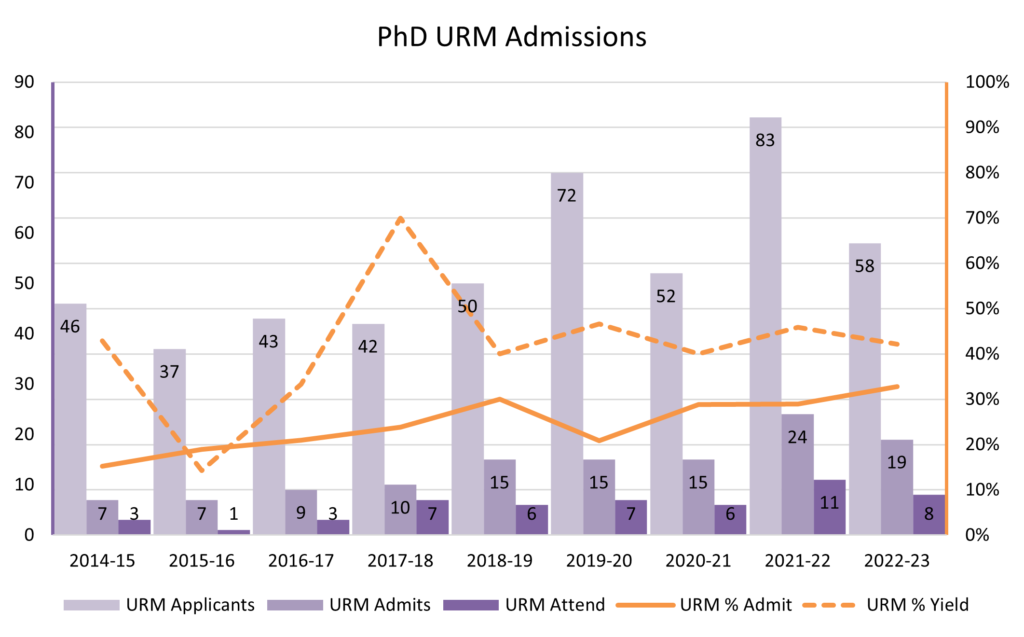
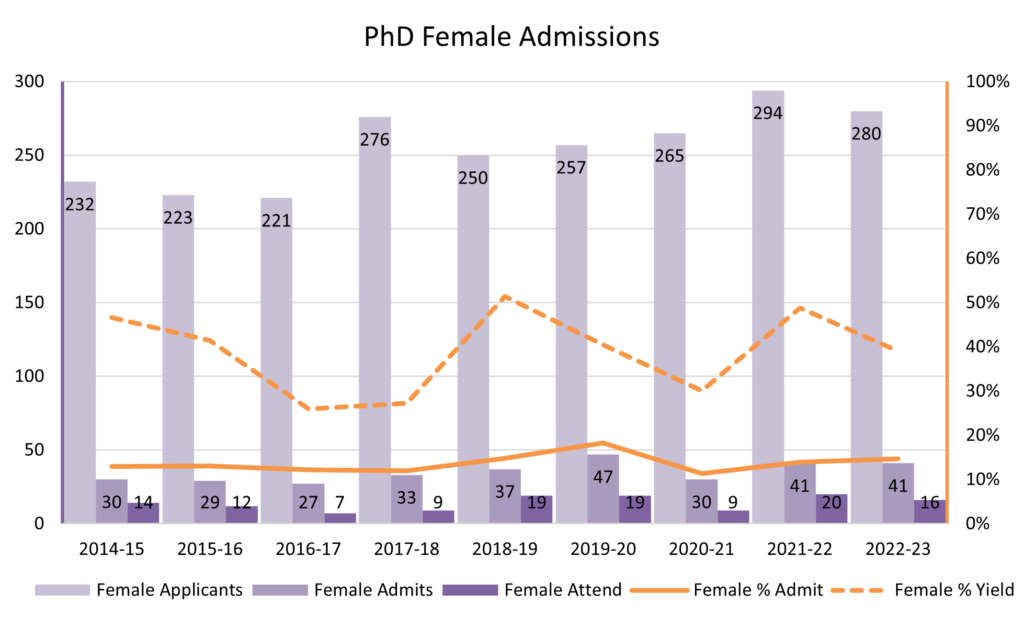
PhD
Applications to the PhD program are evaluated by a committee composed of faculty, staff and senior graduate students. The Admissions Committee weighs many factors, including applicants’ academic record and scholarly activities, letters of recommendation, and the statement of purpose. We also seek a balance between the students’ research interests and available faculty resources. The Graduate Record Examination (GRE) is no longer required for admission.
Graduation
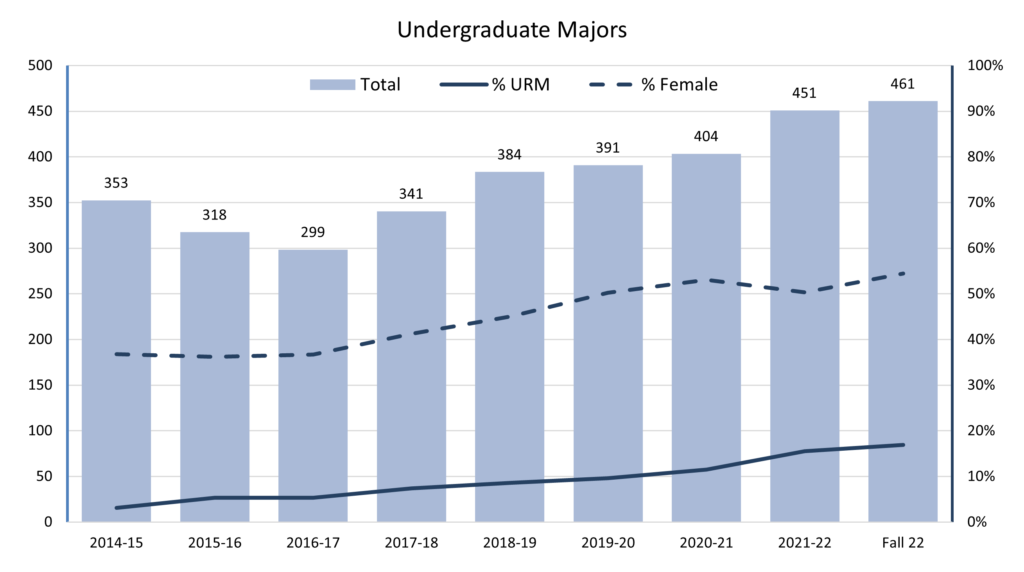
Undergraduate
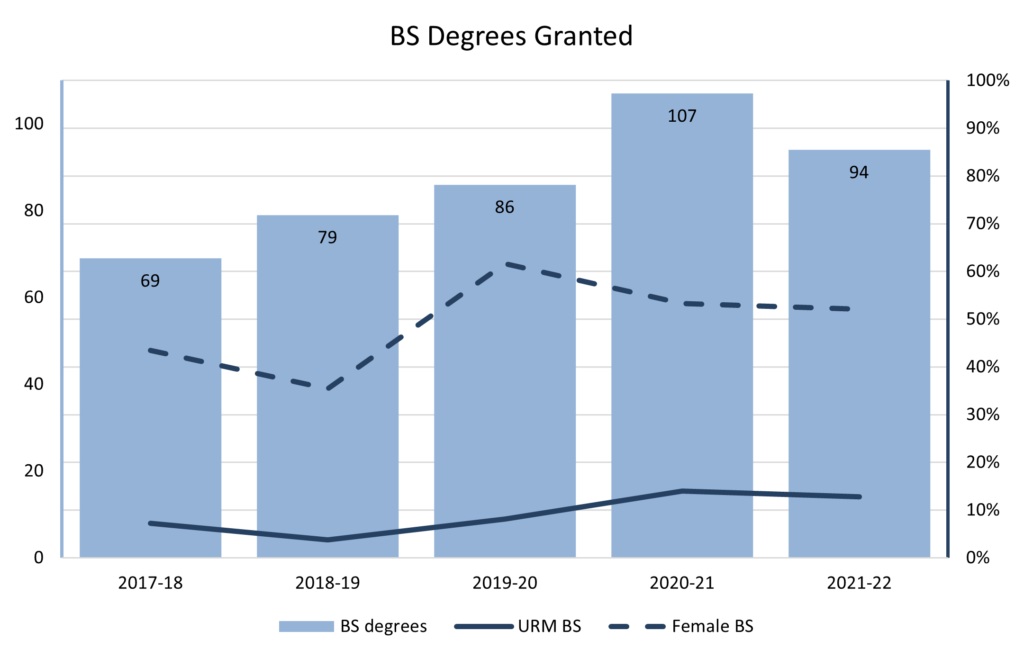
Average time to a Bachelors Degree in Bioengineering for students admitted as freshmen is 7.9 semesters, or a median of 8 semesters.
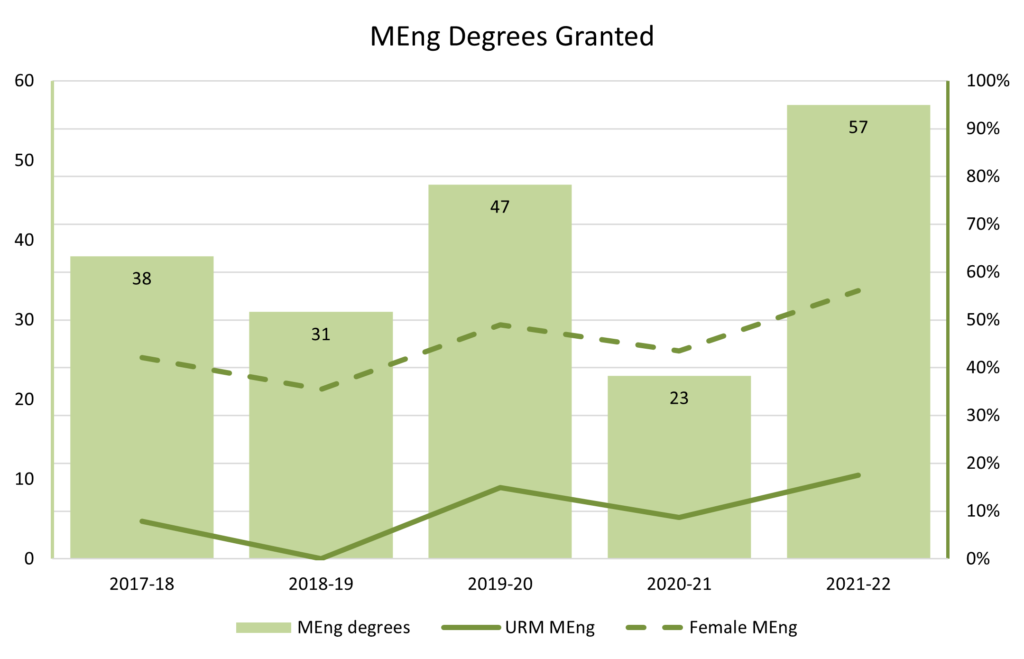
Master of Engineering
Average and median time to degree for the Master of Engineering is 2 semesters.
Master of Translational Medicine
Average and median time to degree for the MTM is one academic year.
PhD
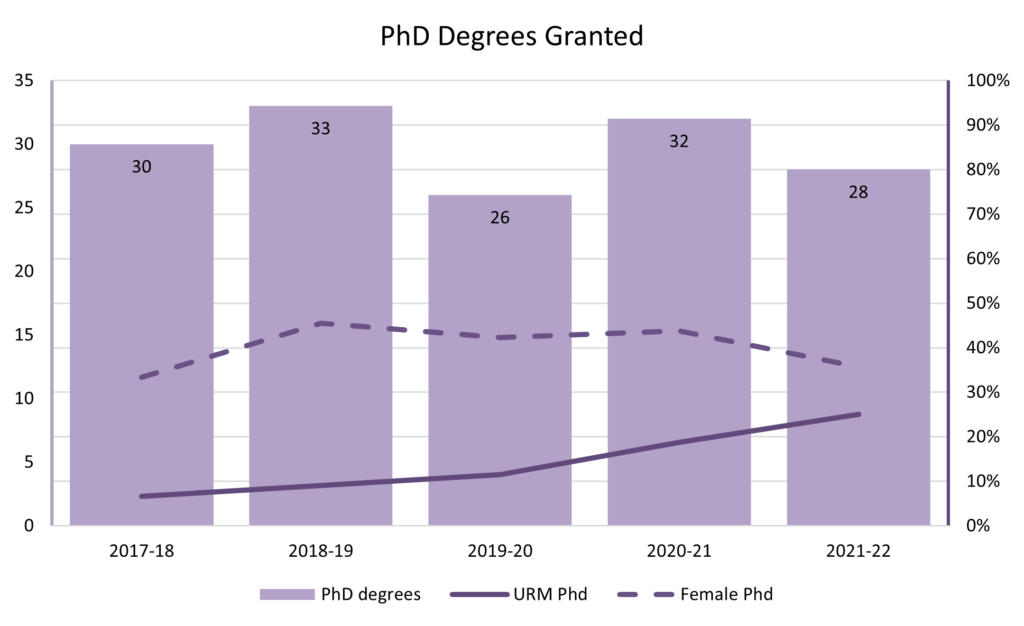
Average time to a PhD in Bioengineering is 5.3 years, with a median of 5.3 years.
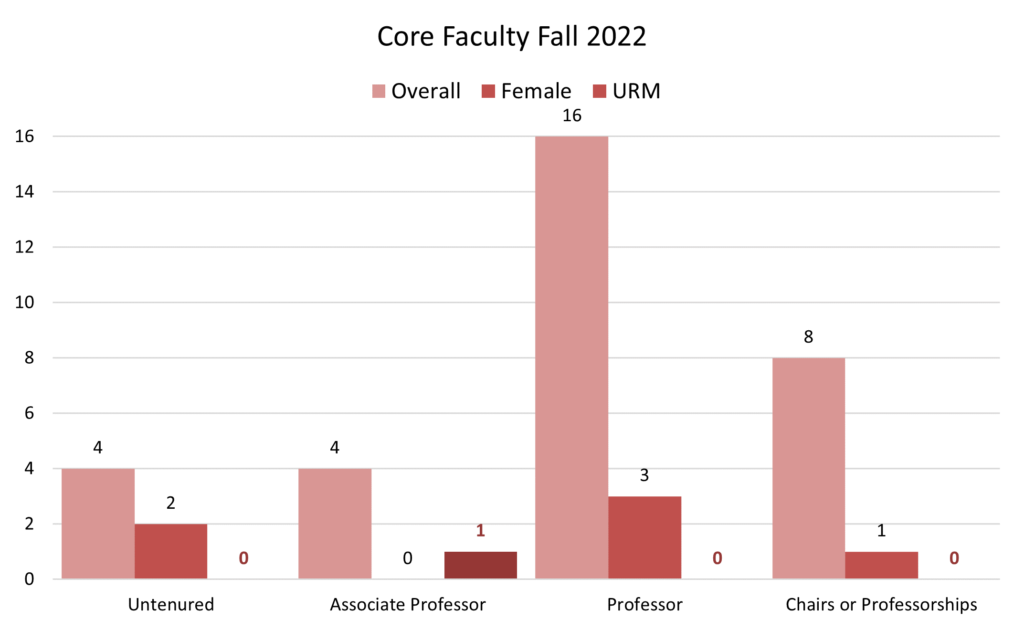
Department of Bioengineering Faculty
Core faculty are professors or tenured lecturers with 50% or more of their appointment in the Department of Bioengineering.